Your podcast discovery platform
Curious minds select the most fascinating podcasts from around the world. Discover hand-piqd audio recommendations on your favorite topics.

piqer for: Climate and Environment Global finds Globalization and politics
I'm a freelance journalist, currently based in Madrid. I used to be a News Producer at CNBC in London before, but I thought a little bit more sun might do me good. Now I write for several news organizations, covering a range of topics, from Spanish politics and human rights for Deutsche Welle to climate change for La Marea.
Infographics: A Monumental Map Of All Past, Present And Future Coal
Last month, I wrote an article about the status of the coal industry (concerning mining and electricity production) in Spain. Of all the fossil fuels, coal is the one that produces the most CO2, and big efforts are being made to eliminate it from the mix.
Mine was a rather humble article. I pulled the Spanish data from reports and official websites, contacted the companies, talked to environmentalists and labor unions, and interviewed people directly affected by the closure. It took me less than a couple of weeks.
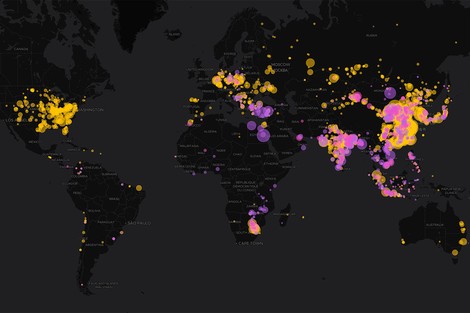
Then I stumbled across this infographic by Simon Evans and Rosamund Pearce for Carbon Brief. To say something, the work is nothing short of monumental. Here you have over 10,000 thermal coal plants in 95 countries, including retired and planned ones. Hover your mouse and you can see the kind of coal they burn, their power and their emissions, and you can play with a slider to see how things have changed since the year 2000.
The map alone had already blown my mind, but there's more. Scroll down and you'll find a rich and comprehensive text, sprinkled with graphs and data, that will help you interpret the map. Contrary to Carbon Brief's usual style, which rather sits on the technical side, this is an article anyone can, and should, pick up and read.
The text starts by briefly explaining how to use the infographic and then goes on to set the context: A brief history of coal use, its expansion and (likely) decline due to environmental and economic concerns.
But the really interesting part comes right after. The authors have selected a few examples of data you can extract from the map and explained it. So they show the evolution in different regions, pointing at the reasons behind it, with lots of links, which make further reading and research easy.
This piece is something rare and fantastic. Really, the best piece of data journalism I've seen in ages. Maybe ever.
Stay up to date – with a newsletter from your channel on Climate and Environment.